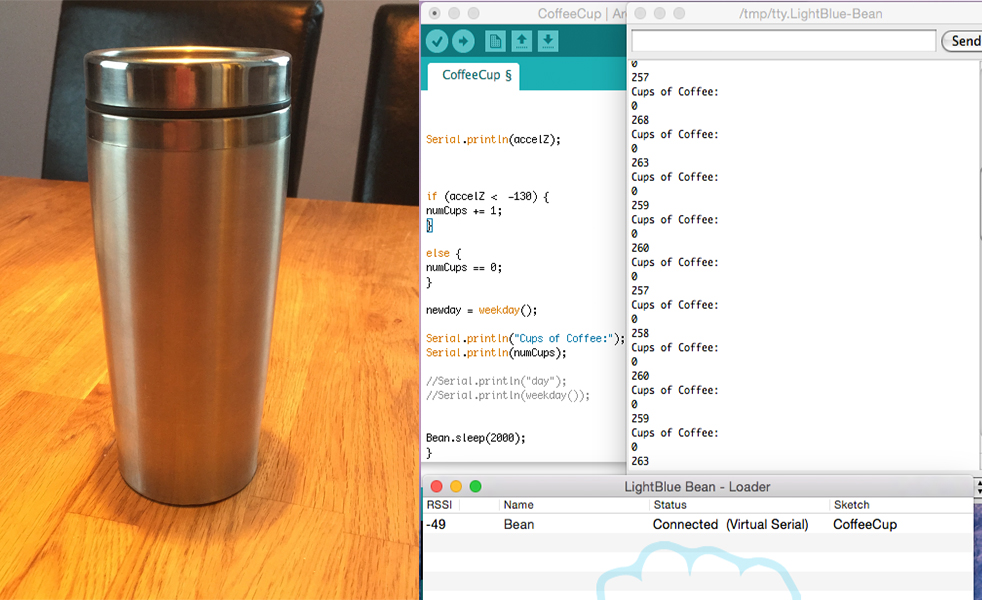
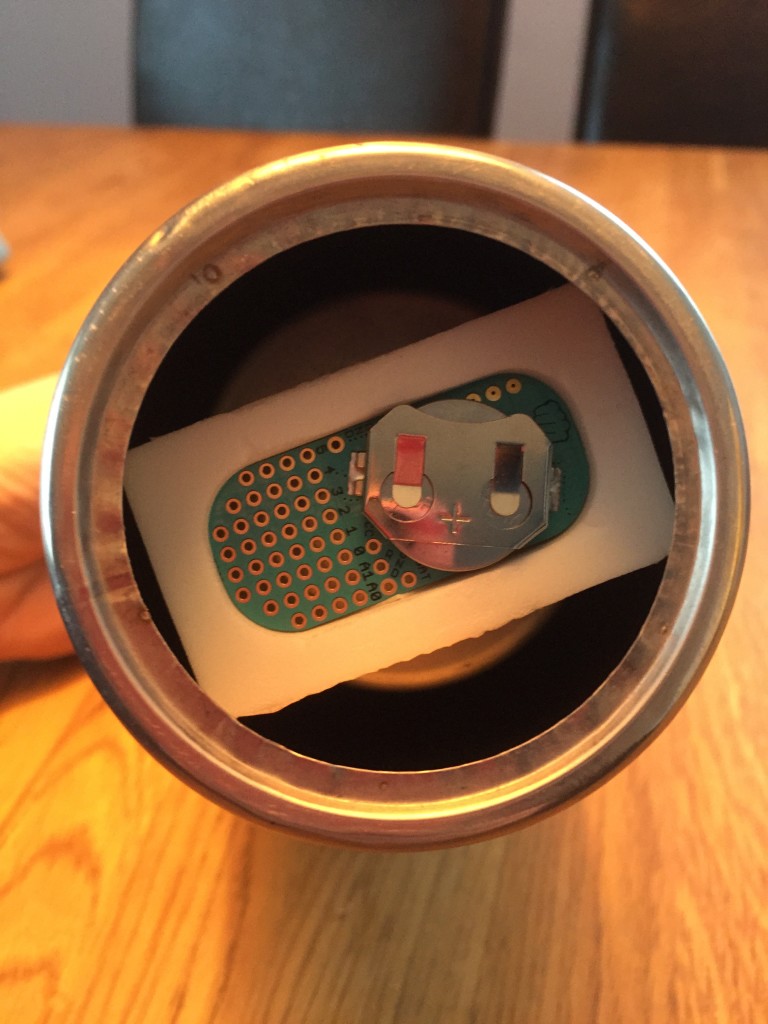
JavaBean isn’t your average coffee cup- JavaBean is equipped with a LightBlue Bean microcontroller that connects via bluetooth to your computer and tells you how much coffee you’ve consumed today. The LightBlue Bean device rests in the underbelly of the JavaBean coffee cup, completely out of sight:
A simple Arduino sketch uploaded to the bean tells JavaBean to count the number of cups of coffee you’ve consumed in the current day, based on accelerometer readings gathered from the device:
#include

int numCups = 0;
int newday;

void setup() {
// initialize serial communication at 57600 bits per second:
Serial.begin(57600);

}

void loop() {
//if it's the same day as it was the last time we ran the loop
//get the accelerometer readings
if(newday == weekday()){

  int16_t accelX;
  int16_t accelY;
  int16_t accelZ;

accelX = Bean.getAccelerationX();
accelY = Bean.getAccelerationY();
accelZ = Bean.getAccelerationZ();

Serial.println(accelZ);

//if the z acceleration indicated that the cup is titled enough,
//increase the number of cups of coffee consumed
if (accelZ <  -130) {
numCups += 1;
}
//if it's a different day than the last time we ran the loop,
// reset the number of cups of coffee consumed to 0
else {
numCups == 0;
}

newday = weekday();

Serial.println("Cups of Coffee:");
Serial.println(numCups);

//Serial.println("day");
//Serial.println(weekday());

Bean.sleep(2000);
}
When JavaBean is upright, the z accelerometer gets positive readings, and keeps the number of cups of coffee consumed at 0: 
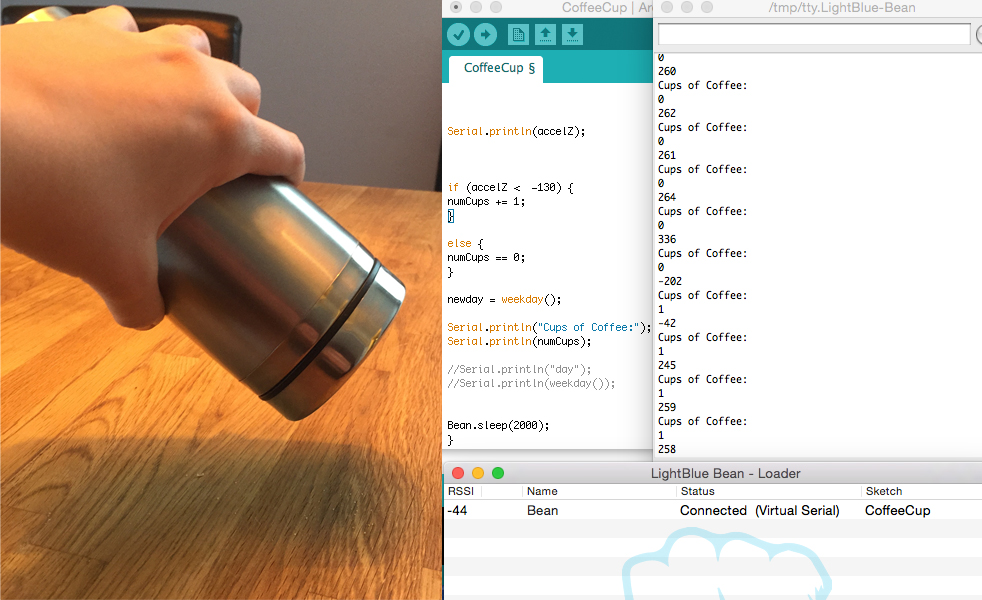
When JavaBean is titled to a level that would indicate empty (aka the z-axis accelerometer reads below -130 [it registers at -202 in this photo]), the number of cups of coffee consumed increases:
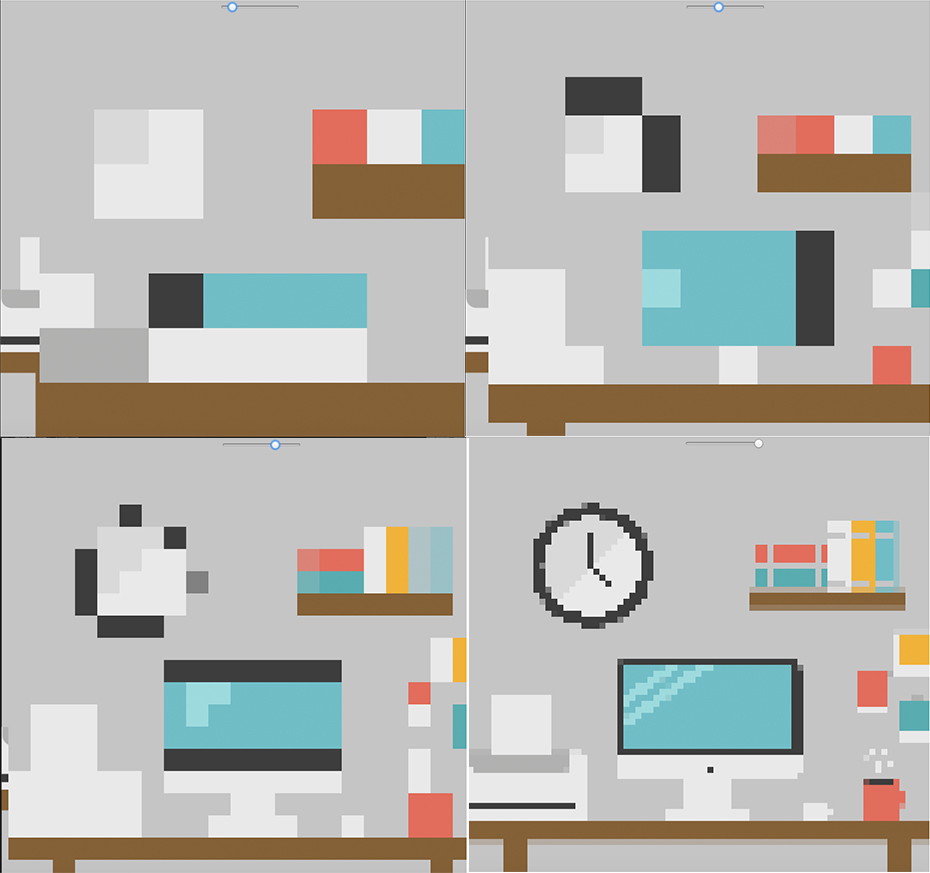
The JavaBean coffee cup and the accompanying visualization is a statement on modern “coffee culture.” As the number of cups of coffee consumed increase, the workspace becomes clearer and less pixelated in the visualization. This visual interpretation of coffee drinking represents the notion that one “can’t be productive” without an IV of coffee. I’ve intentionally made the visualization here pixelated at all levels of consumption to indicate the unrealistic expectations people have of the power of coffee. Is your coffee really what makes you productive, or is it your attitude?
Here’s the code I used for the visualization in p5.js (this is the sketch, in order for this code to work, you’ll have to make sure the p5.js dom library is uncommented from the html file associated with the sketch.js you paste this into.) :
var coffeeSlider;
var blockSize;

function setup() {
createCanvas(800, 800);
desk = loadImage('minimalistdesk2.png');
desk.loadPixels();
coffeeSlider = createSlider(0, 10, 2);
coffeeSlider.position(width/2, 10);

}

function draw() {
background(0);
if (coffeeSlider.value() == 0) {
fill(255);
stroke(255);
textSize(24);
textFont("Arial");
text("DRINK COFFEE TO CONTINUE", width, height/2);
}else if (coffeeSlider.value() > 0) {
image(desk, 0, 0, 800, 800);
blockSize = (map(coffeeSlider.value(), 0, 10, 100, 10));

for (var y = 0; y < desk.height; y += blockSize) {
for (var x = 0; x < desk.width; x += blockSize) {
var c = desk.get(x, y);
fill(c);
noStroke();
rect(x, y, blockSize, blockSize);
}
}

}

}


